The 12-metric web analytics checklist
Track these 12 metrics, ignore the rest. Most websites need fewer than seven, but the full 12 covers content, ecommerce, and SaaS use cases. All trackable with cookieless analytics tools — no GA4 required.
Web analytics checklist: the 12 metrics that actually matter
- Pageviews — total page loads. Floor metric for trend analysis.
- Unique visitors — distinct people, not page reloads. The audience denominator.
- Top pages — which content earns the visit. Content strategy signal.
- Top referrers — where visitors arrive from. Acquisition mix.
- Country / language — geography for localization + GDPR scope.
- Device class — mobile vs desktop split. UX prioritization.
- Bounce rate (single-page sessions) — content match check.
- Time on site — engagement depth. What time on site actually measures →
- Conversion rate — visits that complete the intended action. The point of the whole exercise.
- Goal completions — total numerator of conversions per goal.
- Custom events — anything specific to your business (newsletter signup, demo request, podcast download).
- UTM source / medium — campaign attribution if you run paid traffic.
That’s it. Skip: average session duration (poorly measured), page value, percent new vs returning (privacy-broken in cookieless), 30+ device sub-categories, screen resolution, ISP, network speed. None of these change a content or product decision.
For privacy-first measurement of all 12, use Plausible, Fathom, Matomo, or Umami — all four cover the full list without cookies. Full cookieless tools comparison →
Most analytics guides throw 20+ metrics at you and call it “essential.” However, tracking everything doesn’t make you data-driven—it makes you data-drowned. The truth is simpler: most websites need only 5-7 essential website metrics to make smart decisions.
I’ve seen businesses paralyzed by dashboards full of numbers they don’t understand. Meanwhile, their competitors focus on a handful of metrics and actually improve. In other words, less data often means clearer answers.
This guide cuts through the noise. You’ll learn which metrics genuinely matter, which ones you can safely ignore, and how to build a minimalist analytics practice that drives results without the complexity.
The Problem with “Track Everything” Analytics
Google Analytics 4 offers hundreds of metrics, dimensions, and reports. Consequently, many website owners feel obligated to monitor all of them. This approach backfires for three reasons:
- Decision paralysis: Too many numbers mean no clear direction
- False precision: Tracking micro-details creates an illusion of control
- Wasted time: Hours spent in dashboards instead of improving your site
Furthermore, complex tracking often requires cookies and consent banners. If you’re tracking data you never use, you’re annoying visitors for nothing. That’s a lose-lose situation.
The minimalist approach flips this script. Instead of asking “what CAN we track?”, ask “what do we NEED to know?” The answer is usually much shorter than you’d expect.
The 7 Essential Website Metrics That Actually Matter
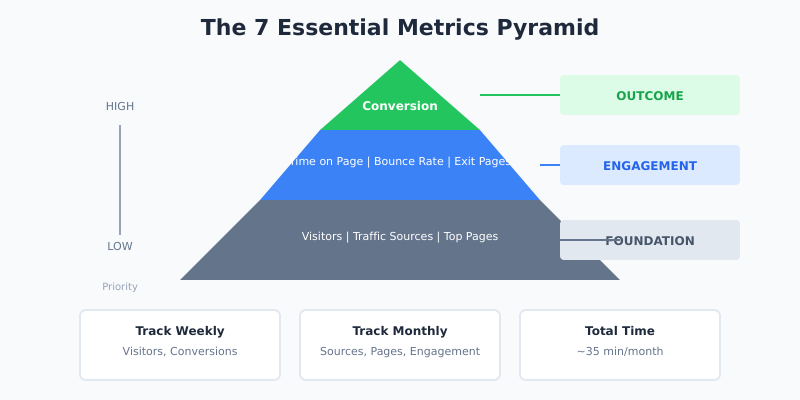
After years of testing analytics tools and helping businesses simplify their tracking, I’ve narrowed it down to seven metrics. These cover the complete visitor journey without the bloat.
1. Unique Visitors
What it tells you: How many individual people visit your site in a given period.
This is your baseline. Everything else builds on knowing your audience size. However, don’t obsess over daily fluctuations. Instead, track weekly or monthly trends to spot meaningful patterns.
When to check: Weekly
What to look for: Consistent growth, sudden drops (technical issues?), or seasonal patterns
2. Traffic Sources
What it tells you: Where your visitors come from—search engines, social media, direct visits, or referrals.
This metric answers a critical question: which channels actually work? For instance, if 80% of your traffic comes from organic search, that’s where your effort should focus. Conversely, if you’re spending hours on social media for 2% of traffic, reconsider that strategy.
When to check: Monthly
What to look for: Your top 3 sources and whether they’re growing or shrinking
3. Top Pages
What it tells you: Which content attracts the most visitors.
Your top 10 pages typically drive 80% of your traffic. Therefore, these pages deserve the most attention. Are they optimized? Do they have clear calls-to-action? Is the information current?
When to check: Monthly
What to look for: Pages that could convert visitors but don’t have CTAs
4. Bounce Rate (With Context)
What it tells you: The percentage of visitors who leave after viewing only one page.
Bounce rate is often misunderstood. A high bounce rate isn’t always bad. For example, if someone finds your contact page, gets your phone number, and calls you—that’s a “bounce” but also a success.
As a result, context matters more than the number itself. Compare bounce rates across similar pages, not against arbitrary benchmarks.
| Page Type | Typical Bounce Rate | When to Worry |
|---|---|---|
| Blog posts | 70-90% | Above 95% |
| Landing pages | 40-60% | Above 80% |
| Product pages | 30-50% | Above 70% |
| Homepage | 40-60% | Above 75% |
When to check: Monthly, per page type
5. Average Time on Page
What it tells you: Whether visitors actually engage with your content.
If your 2,000-word article has an average time of 15 seconds, people aren’t reading it. They’re bouncing. On the other hand, a 3-minute average suggests genuine engagement.
This metric helps you distinguish between “traffic” and “attention.” Specifically, it reveals whether your content delivers what visitors expected to find.
When to check: Monthly, for key content pages
What to look for: Time that makes sense for your content length
6. Conversion Rate
What it tells you: The percentage of visitors who complete your desired action.
This is arguably the most important metric because it connects traffic to business outcomes. A “conversion” could be:
- Newsletter signup
- Contact form submission
- Product purchase
- Free trial registration
- Download
Pick ONE primary conversion that matters most to your business. Track that obsessively. Everything else is secondary.
When to check: Weekly
What to look for: Trends over time, not day-to-day fluctuations
7. Exit Pages
What it tells you: Where visitors leave your site.
Exit pages reveal friction points. If many visitors leave from your pricing page, perhaps the prices aren’t clear—or they’re too high. If they leave from a blog post, that’s normal and expected.
Consequently, focus on exit rates for pages that SHOULD lead somewhere else: product pages, checkout steps, or lead generation pages.
When to check: Monthly
What to look for: High exit rates on pages designed to convert
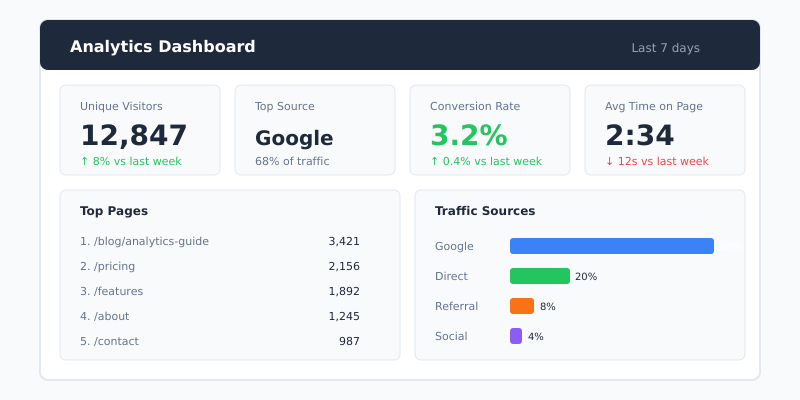
Building Your Minimalist Analytics Dashboard
Now that you know WHAT to track, let’s discuss HOW to organize it. The goal is a single-screen dashboard you can review in under 5 minutes.
The One-Page Dashboard Concept
Your analytics should fit on one screen. If you need to scroll, click, or navigate between reports to understand your site’s health, you’re overcomplicating things.
Most privacy-first analytics tools like Plausible and Fathom are built around this principle. Everything important appears on a single page. In contrast, GA4 buries essential data across dozens of reports.
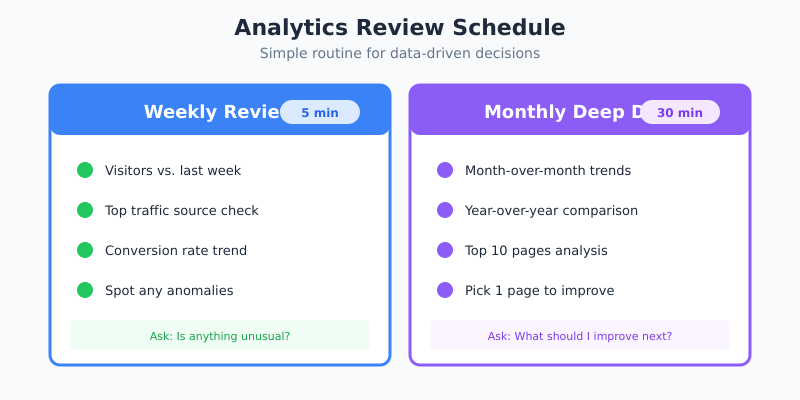
Weekly Review Ritual (5 Minutes)
Here’s a simple routine that keeps you informed without becoming a time sink:
- Visitors this week vs. last week: Up, down, or stable?
- Top traffic source: Any surprises?
- Conversion rate: Moving in the right direction?
- Any anomalies: Sudden spikes or drops?
That’s it. Five minutes, four questions. If something looks off, dig deeper. Otherwise, move on with your day.
Monthly Deep Dive (30 Minutes)
Once a month, spend more time analyzing trends:
- Compare this month to last month AND the same month last year
- Review your top 10 pages—any changes?
- Check traffic sources distribution
- Identify one page to improve based on exit rate or low engagement
This monthly ritual prevents seasonal patterns from catching you off guard and keeps your content strategy data-informed.
Metrics You Can Safely Ignore
Here’s the controversial part. Many “essential metrics” guides include numbers that most small businesses can completely ignore. Let me explain why.
Page Views
Page views count total pages loaded, including refreshes and your own visits. This metric inflates your ego but rarely informs decisions. Unique visitors matter more.
Sessions
A “session” is an arbitrary time window (usually 30 minutes). If someone visits, leaves, and returns 31 minutes later, that’s two sessions. Does this distinction help you improve your site? Rarely.
New vs. Returning Visitors
This metric sounds useful but proves unreliable. Privacy tools, browser updates, and device switches make the data increasingly inaccurate. Moreover, the actionable insights are limited—what would you do differently based on this split?
Demographics (Age, Gender, Interests)
These require invasive tracking and often rely on Google’s guesses rather than actual data. For most sites, they’re not worth the privacy trade-off. If you need demographic data, surveys work better.
Real-Time Visitors
Watching visitors arrive in real-time is addictive but rarely useful. Unless you’re running a live event or flash sale, this metric just wastes your time. Check it once for fun, then ignore it.
When the Minimalist Approach Doesn’t Work
To be fair, minimalist analytics isn’t for everyone. Certain situations genuinely require more comprehensive tracking:
E-commerce with Complex Funnels
If you’re selling products online, you need more granular conversion tracking. Cart abandonment rates, checkout step completion, and product performance metrics become essential. That said, you still don’t need everything GA4 offers.
SaaS with Trial-to-Paid Conversions
SaaS customer journeys span weeks or months. Tracking trial signups, activation events, and conversion timing requires more sophisticated analytics. However, you can still apply minimalist principles by focusing on the metrics that predict paid conversion.
Large Marketing Teams with Multiple Channels
When you’re spending significant budgets across many channels, attribution modeling matters. You need to know which touchpoints contribute to conversions. In this case, consider dedicated attribution tools rather than cramming everything into your website analytics.
Regulated Industries
Healthcare, finance, and other regulated industries may have compliance requirements that mandate certain tracking. Always check your legal obligations first.
Choosing the Right Tool for Minimalist Analytics
Your choice of analytics platform shapes your entire experience. Some tools encourage complexity; others embrace simplicity.
| Tool | Best For | Complexity Level | Privacy |
|---|---|---|---|
| Plausible | Minimalists who want privacy | Very Low | Excellent |
| Fathom | Privacy-focused businesses | Low | Excellent |
| Rybbit | Budget-conscious site owners | Low | Excellent |
| Simple Analytics | True minimalists | Very Low | Excellent |
| GA4 | Complex tracking needs | High | Poor |
If you’re reading this article, you’re probably a good fit for the privacy-first tools in this list. They’re designed around the minimalist philosophy—showing you what matters without the clutter.
For a deeper comparison, check out my Plausible vs Fathom analysis or the Rybbit review.
The Minimalist’s Analytics Checklist
Before wrapping up, here’s your actionable checklist. Print it, bookmark it, or save it somewhere you’ll actually see it.
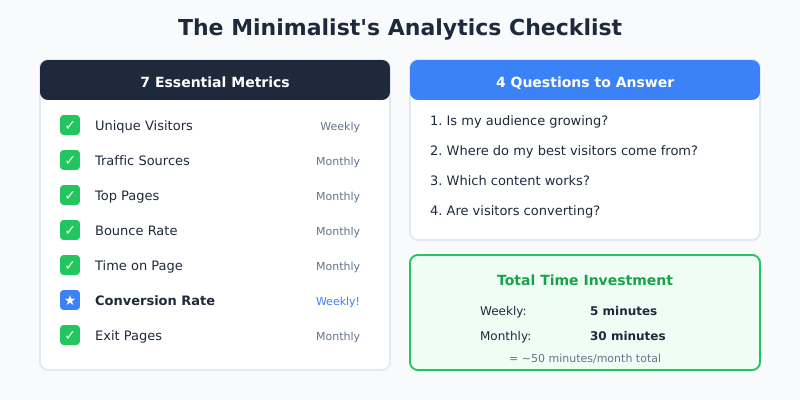
Essential Metrics to Track
- ☑️ Unique visitors (weekly trend)
- ☑️ Traffic sources (top 3)
- ☑️ Top pages (top 10)
- ☑️ Bounce rate (by page type)
- ☑️ Average time on page (for key content)
- ☑️ Conversion rate (ONE primary conversion)
- ☑️ Exit pages (for conversion-focused pages only)
Review Schedule
- Weekly: 5-minute dashboard check
- Monthly: 30-minute trend analysis
- Quarterly: Strategy review based on data
Questions to Answer
- Is my audience growing?
- Where do my best visitors come from?
- Which content works?
- Are visitors converting?
If your analytics setup answers these four questions clearly, you have everything you need.
Bottom Line
You don’t need 20 metrics to run a successful website. In fact, tracking too much often hurts more than it helps. The essential website metrics that actually drive decisions fit on one hand: visitors, sources, top pages, engagement, and conversions.
Start with these seven metrics. Master them. Only add more when you have a specific question that requires additional data. This minimalist approach saves time, respects visitor privacy, and—most importantly—leads to better decisions.
The goal of analytics isn’t to collect data. It’s to improve your website. Sometimes, less data helps you see more clearly.
Frequently Asked Questions
How many metrics is too many for a small website?
More than seven is usually too many for a single owner or small team. The brain can’t track meaningful trends across dozens of numbers at once. Stick to visitors, sources, top pages, bounce rate, time on page, conversion rate and exit pages — everything else is a distraction.
Should I track everything just in case I need it later?
No. Excess tracking slows your site, often requires a cookie banner that hurts opt-in rates, and creates dashboards you never read. Only add a metric when you have a specific question that requires it. You can always switch tracking on later when a real need appears.
What counts as a vanity metric in web analytics?
A vanity metric is one that looks impressive but doesn’t change your decisions. Total page views, social media followers and raw session counts usually fall into this category. If improving a metric wouldn’t change what you do tomorrow, it’s vanity.
When should I add a new KPI to my dashboard?
When you have a concrete decision that the current metrics can’t answer. For example, adding cart abandonment rate makes sense once you’re optimizing checkout. Adding cohort retention makes sense once you’re investing in lifecycle marketing. Otherwise, hold off.
Is it safe to trust GA4 metrics for a small site?
GA4 numbers are directionally useful but rarely precise on small sites. Sampling, consent banner drop-off, ad blockers and bot filtering all distort the data. For a few hundred visitors a month, a privacy-friendly tool that captures 100% of traffic without a banner gives a more honest baseline.
What’s the difference between unique visitors and sessions?
Unique visitors counts individual people in a time window. Sessions counts visits, which means the same person can generate several sessions in a day if they leave and come back. Unique visitors is the more useful baseline for most decisions; sessions matters mainly when you’re analyzing engagement patterns.
Do I need to check analytics every day?
No. Daily checks amplify noise and encourage reactive decisions on data that hasn’t stabilized yet. A five-minute weekly review and a 30-minute monthly deep dive cover almost every situation a small site faces.

