SaaS growth is won (or lost) in the spaces between touchpoints: the moments from ad click to trial signup, from first “aha” to the first invoice, from a quiet account to an outspoken champion. Customer Journey Analytics connects those dots so you can shorten time-to-value, raise trial-to-paid conversion, and keep churn in check.
Below is a practical, business-focused playbook you can put to work this quarter.
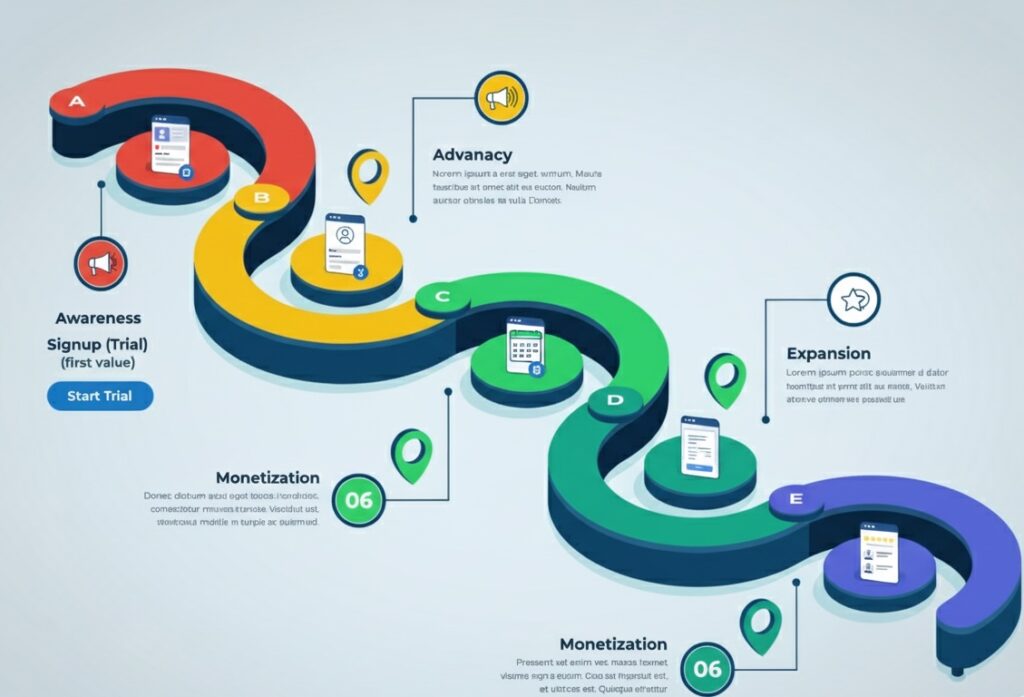
Map the SaaS journey (and the questions each stage must answer)
Awareness → Signup (Trial/Free plan)
- Questions: Which channels bring PQLs, not just clicks? What messages set accurate expectations?
- Owner: Marketing
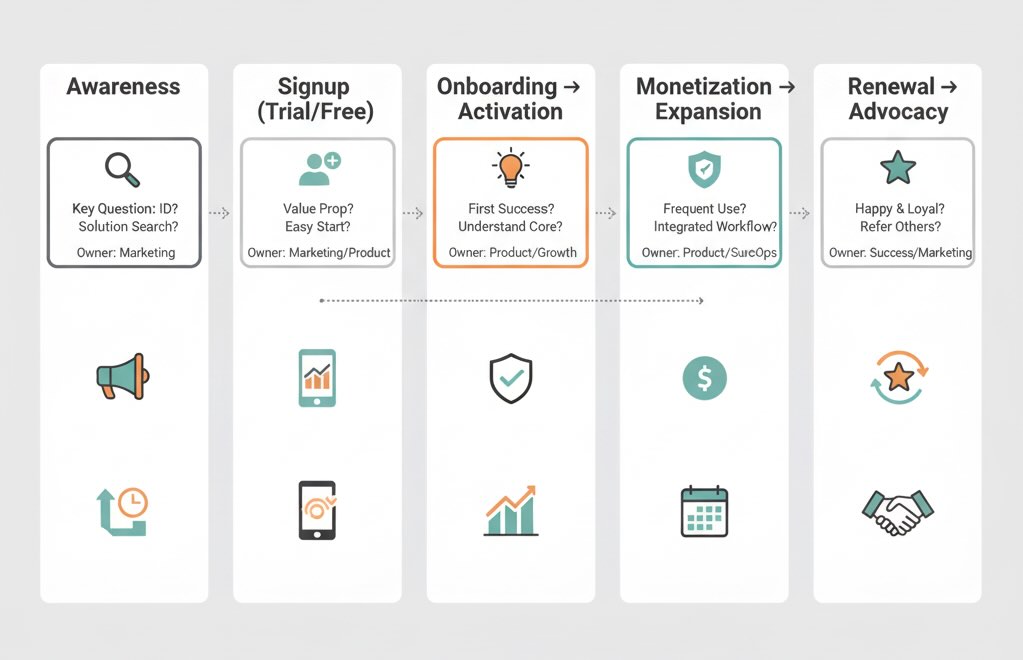
Onboarding → Activation (first value)
- Questions: What must a user do to experience core value? Where do they stall?
- Owner: Product + Growth
Adoption → Habit (weekly/monthly use)
- Questions: Which features correlate with retention and expansion? What does healthy usage look like?
- Owner: Product
Monetization → Expansion
- Questions: What behaviors predict trial-to-paid, seat growth, or upsell? When do we nudge pricing/plan?
- Owner: RevOps + Sales + Growth
Renewal → Advocacy
- Questions: Who is at risk, who is ripe for case studies, reviews, or referrals?
- Owner: Success + Marketing
Build a trustworthy data foundation
- Event taxonomy: Define the minimum viable events tied to value, not vanity. Examples:
Signed Up,Invited Teammate,Imported Data,Created First Project,Completed [JTBD],Upgraded Plan,Added Seat,Cancelled Subscription.
- Identity resolution: Use a stable user_id and account_id. Capture email, plan, role, utm parameters, and source. Stitch product events with CRM (opportunities), billing (MRR, plan), and support (tickets, tags).
- Governance: Document events, owners, and definitions (e.g., what exactly is “Activation”?). Lock definitions before reporting. Version them when they change.
- Privacy & consent: First-party collection with clear consent; minimize PII in raw events; honor deletion requests.
Tip: If you can’t explain your Activation definition in one sentence, it’s not ready.
The metrics that matter at each stage
Acquisition
- PQL rate: % of signups that hit predefined product behaviors indicating sales-ready interest.
- Channel quality: Trial-to-paid by source/campaign, not just CTR/CPL.
- Time-to-first-visit after signup: Long gaps signal leaky handoffs.
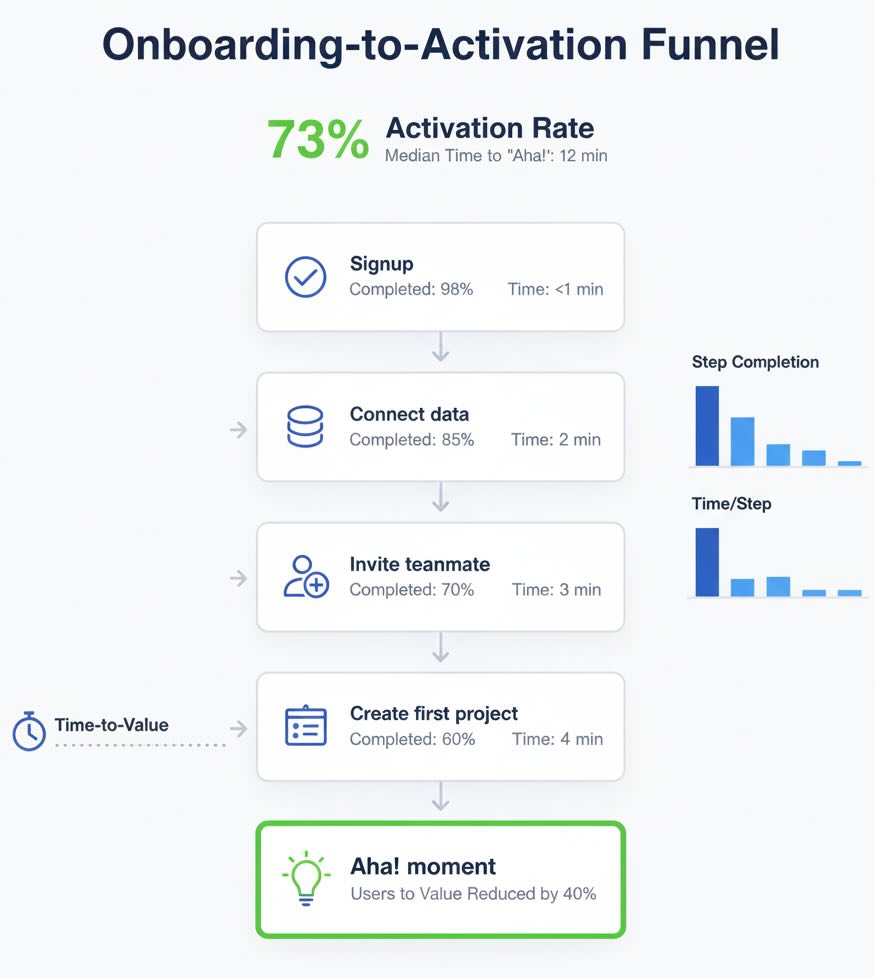
Onboarding & Activation
- Time-to-Value (TTV): Median time from signup to the first “aha” event (e.g., first report created, data connected).
- Activation rate: % of new users reaching your “aha” within X days.
- Funnel drop-off: Step-level loss across the first session, first day, and first week.
Adoption & Engagement
- WAU/MAU ratio (stickiness): Are users returning weekly?
- Depth of use: Median number of key actions per active user (e.g., dashboards viewed, tasks completed).
- Feature adoption curves: Track the % of accounts using new or high-value features by cohort.
Monetization & Expansion
- Trial-to-Paid conversion (user- and account-level).
- ARPA/ARPU and payback period (CAC to gross margin).
- Expansion velocity: Time from first payment to first expansion (seats, add-ons).
Retention & Churn
- Logo churn, revenue churn, GRR, NRR.
- Leading indicators: Drop in sessions or key actions, fewer collaborators, unresolved high-severity tickets, NPS dips.
- Cohort retention: Week-4 and Month-3 account retention by segment.
Advocacy
- Referral rate (invites sent, referral signups).
- Review volume/CSAT/NPS tied to lifecycle milestones (after value moments, not after support fires).
Analytical techniques that reveal “why,” not just “what”
- Cohort analysis: Segment by signup month, channel, role, company size, or use case. Compare trial-to-paid and Month-3 retention side-by-side.
- Path & sequence analysis: Common paths to activation; sequences that precede churn.
- Survival analysis: Estimate time-to-churn and how interventions shift the curve.
- Attribution beyond marketing: Apply multi-touch thinking inside the product—what combinations of in-app actions lead to upgrade?
- Account health scoring: Transparent, weighted model (usage depth 40%, breadth/collaboration 25%, outcomes 20%, sentiment 15%). Share it with CS and iterate.
Five high-impact SaaS playbooks
1) Cut Time-to-Value in half
- Find the friction: Rebuild the onboarding funnel with step-level completion and time-per-step.
- Reduce steps & choices: Ask only what you need for personalization.
- Guide in-context: Empty states, pre-filled templates, and progressive walkthroughs outperform “docs only.”
- Outcome metric: Activation rate ↑, TTV ↓, trial-to-paid ↑.
2) Lift Trial-to-Paid with PQLs and timely nudges
- Define PQLs: e.g., “Imported data + created 2 dashboards + invited 1 teammate.”
- Route in real time: When an account hits PQL, alert sales/CSM with context (use case, blockers, last actions).
- Price at the moment of value: Show plan comparisons right after a value-confirming action, not randomly.
- Outcome metric: PQL-to-close rate ↑, sales cycle ↓.
3) Predict and prevent churn
- Signals: 2+ week activity drop, admin churn, declining collaboration, repeated “how-to” tickets, NPS ≤ 6.
- Actions: Trigger in-app help, send “rescue” email with a 3-step quick-win, schedule Success check-in.
- Model: Start simple with rules, then layer a lightweight ML model. Keep the features explainable.
4) Drive expansion through value milestones
- Milestone map: Seats added after “team collaboration” threshold; storage add-on after “data volume” threshold; premium features after “advanced use” threshold.
- In-product prompts: Contextual, with forecasted benefit (e.g., “Add 3 seats to unlock shared workflows”).
- Outcome metric: NRR ↑ without flooding users with upsell noise.
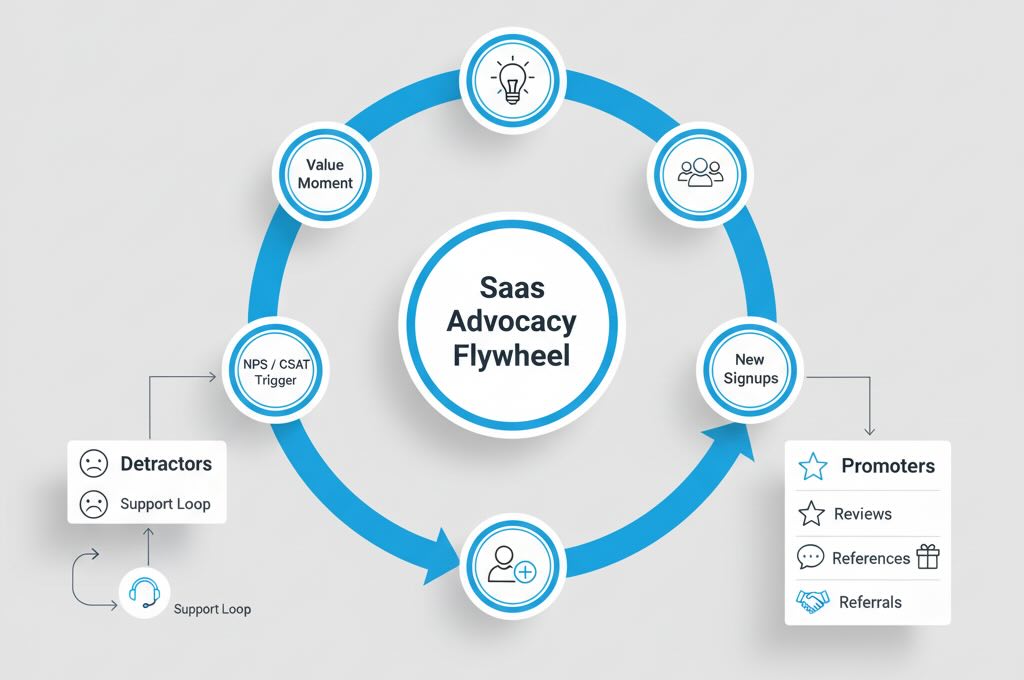
5) Turn users into advocates
- Ask at the right time: Trigger NPS/CSAT after meaningful outcomes (project shipped, report shared), not after a random login.
- Close the loop: Route Detractors to Support/CS; invite Promoters to reviews, references, and communities.
- Measure: Review volume, referral signups, community engagement.
Team, cadence, and decision hygiene
- Clear owners per stage (Marketing, Product, CS, Sales, RevOps).
- North Star + guardrails: e.g., “Activated Accounts” as the North Star, guarded by GRR/NRR and CSAT.
- Weekly ritual: A 30-minute journey review—new cohort health, experiments in flight, top friction, one committed fix.
- One definition of truth: Centralized metrics glossary; every dashboard links to it.
Tooling that scales with you
- Collection/CDP: Segment/Snowplow/first-party SDKs to capture events consistently.
- Warehouse: BigQuery/Redshift/Snowflake as the system of record.
- Product analytics: Amplitude/Mixpanel/Heap for self-serve exploration.
- BI: Looker/Mode/Power BI for executive reporting.
- Reverse ETL: Push health scores and segments to CRM, email, in-app messaging.
- Governance: Linters/tests on event payloads; schema versioning; data quality alerts.
Quick start (30-day plan)
Week 1: Agree on the Activation definition and the three events that prove it. Instrument those events end-to-end.
Week 2: Build onboarding and trial-to-paid funnels; break out by channel and company size.
Week 3: Identify top two friction points; ship one UX fix and one guidance improvement.
Week 4: Define a simple PQL, set Slack alerts, and pilot a Sales/CS follow-up play. Publish a one-page scorecard (TTV, Activation rate, Trial-to-Paid, W4 retention).
Bottom line: Customer Journey Analytics makes SaaS growth repeatable. When you anchor teams on a shared journey map, trustworthy events, and stage-specific metrics, you’ll move customers faster from trial to habit, from habit to revenue, and from revenue to advocacy—while keeping churn from stealing your hard-won gains.