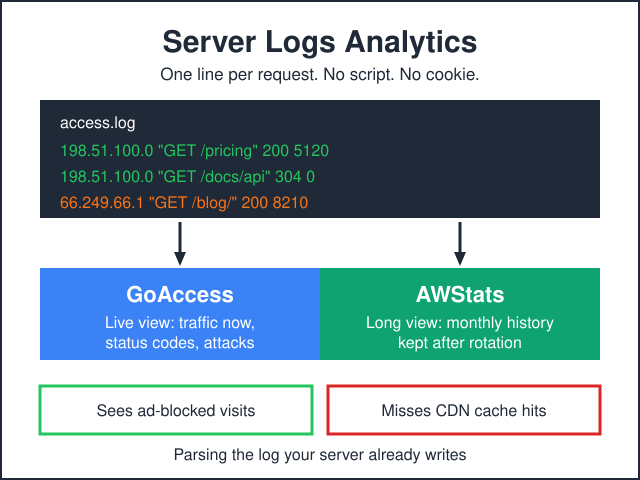
Server logs analytics means parsing the access log your web server already writes — one line per request — instead of running a script in the visitor’s browser. Two tools carry this workload. GoAccess gives you a live dashboard, in a terminal or a self-refreshing HTML page. AWStats keeps month-over-month history that outlives log rotation. Both cost nothing beyond the server you already pay for, and neither needs a tracking script or a cookie.
The trade-off is real, though. Logs count bots, prefetchers and uptime monitors alongside humans, so raw totals run high until you filter them. Worse, if you sit behind a CDN, every response served from the edge cache never touches your origin log. That gap is what makes a fresh log setup feel broken in its first week: you compare the numbers to your JavaScript tool, see nonsense, and walk away. Therefore fix bot filtering and the CDN gap before you trust a single figure. Installing GoAccess is the short part; calibrating what it tells you is the actual job.
What server logs analytics actually measures
Every request writes one line. In the standard combined format that line holds the client IP, timestamp, method and path, status code, response size, referrer and user agent. Nothing else. No JavaScript runs, so nothing depends on the visitor’s browser cooperating.
That cuts both ways. Logs catch traffic client-side tools structurally cannot:
- Ad-blocked and script-blocked visitors. A blocked analytics script produces no beacon. The request that delivered the page is still in your log.
- Non-browser clients. Feed readers,
curl, package managers, uptime probes, AI crawlers pulling your content for training or retrieval. - Errors and dead ends. 404s, 500s, redirect chains, requests that timed out before rendering.
- Raw file access and bandwidth by URL. PDF downloads, hotlinked images, podcast audio pulled by an app that never loads your HTML.
Conversely, logs are blind to everything after the bytes leave the server: no scroll depth, no clicks, no viewport, no time on page beyond crude inference. Single-page apps are the worst case — one server request, then a run of in-app route changes that never produce a log line.
Logs answer what did my server hand out, and to whom. A tracking script answers what did a person do on the page. Different questions, and the deeper split is covered in our guide to server-side versus client-side tracking.
Why the client-side stack keeps pushing people back to logs
Nobody arrives at log parsing because it’s fashionable. They arrive because the browser-side stack keeps attaching conditions to numbers they used to take for granted, and two of those conditions are worth naming precisely rather than gesturing at.
The first is consent plumbing. Google Consent Mode v2 has been required since March 2024, adding the ad_user_data and ad_personalization parameters alongside the existing analytics and ad-storage signals. Its legal perimeter is users in the EEA. Google separately extends the same requirement to the UK and Switzerland through its own EU User Consent Policy — that is Google policy rather than the DMA, and the two grounds shouldn’t be welded into one sentence. Where valid signals are missing, you lose personalisation and remarketing for those users, plus part of the measurement feature set.
The second is schema ceilings. A standard GA4 property allows 50 event-scoped custom dimensions and 50 custom metrics, per Google’s GA4 configuration limits. Those slots are registered in the interface before the data arrives, so what you are able to measure is a schema decision taken in advance rather than something the collector works out for you.
An access log has neither constraint. Every request writes every field it has always written — method, path, status, bytes, referrer, user agent — with no registration step, no quota and no consent branch inside the collection path. That is the pitch for server logs analytics in one sentence: fewer moving parts between the request and the record. It isn’t a licence to ignore the law, and the GDPR section below deals with what you do owe. The point is that the failure modes are different, not absent.
GoAccess or AWStats — and why serious setups run both
People treat these as competitors. They aren’t — GoAccess is C with almost no dependencies, AWStats is Perl, and they solve opposite halves of the problem. Running both is cheap because they read the same file.
| GoAccess | AWStats | |
|---|---|---|
| Best at | Right now: live traffic, status codes, attack patterns | Long view: monthly and yearly trends, kept after logs are deleted |
| Output | Terminal UI, self-contained HTML, JSON, CSV | Static HTML pages or CGI, plus its own text database per month |
| Real-time | Yes — WebSocket-driven HTML that updates as lines arrive | No, refresh on cron |
| History after rotation | Only with persistence enabled (--persist) |
Yes, by design — aggregates are stored, not the raw log |
| Bot handling | --ignore-crawlers against a bundled list |
Built-in robot database, separate “not viewed” traffic column |
| Licence | Open source, MIT | Open source, GPL |
The division of labour: GoAccess for the operational view you open when something looks wrong, AWStats for the “is traffic up since spring” question. AWStats keeps that answer after logrotate has deleted the evidence.
A GoAccess setup that survives log rotation
The one-off command is trivial — point it at a log, name the format, get a dashboard:
goaccess /var/log/nginx/access.log --log-format=COMBINEDThat gives you a terminal report and nothing else. The version worth running as infrastructure does four more things.
Read the rotated files too. GoAccess accepts multiple inputs and reads from stdin, so gzipped archives fold in:
zcat -f /var/log/nginx/access.log.*.gz \
 | goaccess - /var/log/nginx/access.log.1 /var/log/nginx/access.log \
 --log-format=COMBINED \
 --ignore-crawlers \
 -o /var/www/stats/index.html
Turn on persistence so today’s numbers survive tomorrow’s rotation — GoAccess writes an on-disk database and restores from it on the next run:
goaccess /var/log/nginx/access.log --log-format=COMBINED \
 --persist --restore --db-path=/var/lib/goaccess -o /var/www/stats/index.html
Run the real-time HTML mode if you want a page that updates itself. GoAccess opens a WebSocket alongside the HTML report; the browser connects back to it. Behind TLS the --ws-url must be the public wss endpoint your reverse proxy exposes, and mismatching it is the usual reason the dashboard renders once and then freezes:
goaccess /var/log/nginx/access.log --log-format=COMBINED \
 --real-time-html --port=7890 --ws-url=wss://stats.example.com:443/ws \
 --daemonize -o /var/www/stats/index.html
Put the report behind auth. A GoAccess HTML page discloses your URL structure, admin paths, referrers and error hotspots — basic auth at minimum, and never inside the public web root of the site you’re measuring. Flags and predefined formats are documented in the GoAccess man page.
AWStats for the long view
AWStats is older and plainer, and it does one thing GoAccess doesn’t do out of the box: it maintains monthly aggregate files, so year-over-year comparison survives on a fraction of the disk the raw logs occupied. The config lives at /etc/awstats/awstats.example.com.conf, and four directives carry the setup:
LogFile="/usr/share/awstats/tools/logresolvemerge.pl /var/log/nginx/access.log* |"
LogFormat=1
SiteDomain="example.com"
DirData="/var/lib/awstats"
That LogFile pipe is the trick worth stealing. logresolvemerge.pl merges every rotated file, decompresses gzip archives and sorts lines chronologically, so a missed cron run doesn’t leave a hole in your history. LogFormat=1 is the combined format nginx and Apache write by default.
Update on a schedule, then build static pages so no CGI is exposed:
/usr/share/awstats/wwwroot/cgi-bin/awstats.pl -config=example.com -update
/usr/share/awstats/tools/awstats_buildstaticpages.pl -config=example.com \
 -dir=/var/www/stats/awstats -awstatsprog=/usr/share/awstats/wwwroot/cgi-bin/awstats.pl
Hourly is plenty. AWStats parses incrementally and remembers its position, so re-running mid-day costs seconds. Paths differ by distribution — Debian, RHEL and the source tarball each place awstats.pl somewhere different. The full directive list, including the exclusion options you’ll need next, is in the AWStats configuration documentation.
The CDN blind spot
Here’s where log analytics quietly breaks. If a CDN serves a response from its edge cache, your origin never sees the request and your log never records it. Every cache HIT is an invisible visitor.
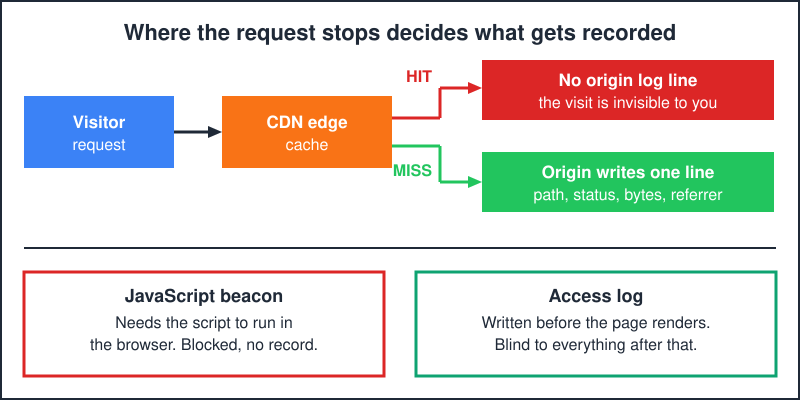
Severity depends on what your CDN caches. A common configuration caches static file extensions and leaves HTML to the origin — on that setup your log still sees every HTML pageview and misses only assets. Turn on full-page caching, however, and your pageview numbers collapse overnight while real traffic is unchanged. Check what your own cache rules actually cover before you read anything into the totals.
Three ways out, in order of cost:
- Measure HTML only and accept undercounted assets. For most content sites this is the right answer.
- Bypass edge cache for HTML while keeping it for static files. On a fast origin that costs little.
- Ingest the CDN’s own logs. Cloudflare and other providers can deliver raw request logs to storage you control, where GoAccess can parse them — check whether your plan includes log delivery before you build on it.
One reassurance: caching inside your server — nginx fastcgi_cache, a WordPress page-cache plugin, Varnish behind nginx — doesn’t cause this. nginx logs cache hits too. Only the edge is invisible.
Bots are the other half of the calibration
A JavaScript tool barely registers automated traffic, because most bots never execute the script. Your log sees all of it: search crawlers, uptime probes, vulnerability scanners, feed fetchers, AI agents pulling content. The share varies enormously by site and by week, so any headline figure about “internet traffic” won’t describe yours — and the whole point of a log is that you can measure your own instead of quoting someone else’s.
So day one of any log setup is subtraction, not analysis. Enable --ignore-crawlers in GoAccess, lean on AWStats’ robot database, then exclude your own monitoring — uptime checks, deploy scripts and your office IP otherwise look like your most loyal visitors (--exclude-ip in GoAccess, SkipHosts in AWStats). Expect the filtered figure to land below your JavaScript tool on some sites and above it on others. They count different populations, and neither is lying.
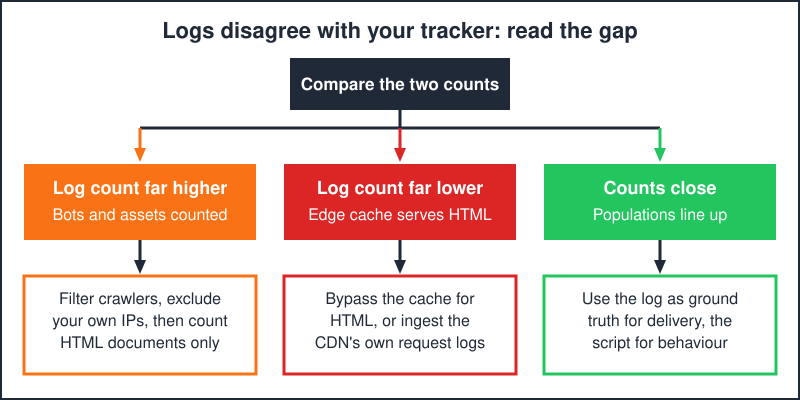
Read the direction of the mismatch as a diagnosis rather than an error. Logs far above the script usually means unfiltered bots and asset requests. Logs far below it usually means the edge is answering for you. Once both are handled and the two numbers land within a few percent of each other, you have something better than either tool alone: two independent measurements that agree.
What logs add to Search Console
The most defensible use of server logs analytics isn’t counting humans at all. It’s watching crawlers — because your log is the only place where every Googlebot request appears with a timestamp, a path and the status code you actually returned.
Search Console answers the other half of that question: whether a crawled URL made it into the index. It comes with quotas, though. The URL Inspection API allows 2,000 queries per day and 600 per minute per site, published in Google’s Search Console API limits reference. The Search Analytics API is capped per request rather than per day: its query reference puts rowLimit in the range 1–25,000, with 1,000 as the default. And the history behind those numbers reaches back only as far as the window Search Console documents in its own help.
The split is therefore natural. Logs tell you what the crawler asked for, how often, and what your server said back — including the 500s, timeouts and redirect chains that quietly consume crawl budget without ever surfacing as a ranking problem. Search Console tells you what Google did with those responses. If a section stops being crawled, the log shows it days before a coverage report does; if a crawled page never gets indexed, only Search Console explains why.
The practical version takes one command: filter the log to Googlebot, group by path prefix and status code, and look for two shapes. Paths burning crawl requests that you don’t care about — faceted parameters, paginated archives, endless calendar pages. And paths you do care about that haven’t been touched in weeks. Both are actionable, and neither is visible in a browser-side tool.
Making it defensible under GDPR
Log analytics gets sold as “privacy-friendly by default”. That’s half true, and worth being precise about.
The consent question turns on device access. The ePrivacy rule that forces cookie banners — Article 5(3) — is triggered by storing information on, or gaining access to information stored in, a user’s terminal equipment. The EDPB’s Guidelines 2/2023 on the technical scope of Article 5(3) — Version 2.0, adopted on 7 October 2024 — work through which techniques fall inside that trigger. Read them before assuming logging is automatically outside it: tracking based on IP alone is one of the use cases they analyse, and the reasoning turns on whether the IP address originates from the user’s terminal equipment.
Passive logging instructs the client to store nothing, which is why access logs generally sit outside the banner requirement. The GDPR still applies regardless, because an IP address is an online identifier and therefore personal data. Three things follow.
Truncate at write time, not at report time, so the raw personal data never lands on disk. In nginx’s log module, with a map:
map $remote_addr $ip_anon {
 ~(?P<ip>\d+\.\d+\.\d+)\. "$ip.0";
 ~(?P<ip>[^:]+:[^:]+:[^:]+): "$ip::";
 default "0.0.0.0";
}

log_format anon '$ip_anon - $remote_user [$time_local] "$request" '
 '$status $body_bytes_sent "$http_referer" "$http_user_agent"';

access_log /var/log/nginx/access.log anon;
GoAccess offers an anonymisation flag too, but it acts after the fact and only affects the report. The server is the stronger place to do it, because nothing unredacted is ever written.
Separate the purposes. If you need full IPs for abuse handling, write two logs: a short-retention full one for security, an anonymised one for analytics. Different purposes, different retention, different access rights — that separation is far easier to defend than one log doing both jobs.
Set retention deliberately. Keep raw logs for days or weeks and let AWStats hold the aggregate history. Aggregates aren’t personal data, so they can stay indefinitely, which is exactly why the GoAccess-plus-AWStats pairing works: the tool that needs raw lines only ever needs recent ones.
Where log analytics runs out of road
Being honest about the ceiling saves a rebuild later. Server logs analytics handles acquisition well and behaviour badly.
- UTM campaigns work. Query strings are part of the logged request, so both tools break campaign parameters out.
- Referrers work, with the usual caveats about referrer-policy stripping.
- Sessions are shaky. Stitching requests into visits means grouping by IP plus user agent. Carrier-grade NAT puts a whole neighbourhood behind one address, and anonymised logging makes it worse by design.
- Funnels need distinct URLs. A checkout living at one route with JavaScript state is invisible.
- No engagement metrics. Nothing about scroll, clicks or dwell time.
What I’d actually run on a content site: logs as ground truth for how much traffic arrived and what was served, plus a lightweight cookieless script for on-page behaviour. The two datasets check each other — when they diverge sharply something is broken, and knowing which one broke is half the diagnosis. For the script half, our comparison of Google Analytics alternatives and the self-hosted versus SaaS guide cover the options.
Frequently asked questions
Do server logs analytics tools need a cookie banner?
Generally no — logging doesn’t instruct the visitor’s device to store anything, and storage or access on terminal equipment is the ePrivacy trigger for consent. GDPR still applies to the IP, so anonymise at write time and set a retention period.
Why do my log numbers differ so much from my JavaScript analytics?
Three causes, usually together: logs include bots that never run scripts, logs miss anything served from a CDN edge cache, and logs count every asset request unless you filter to documents. Fix all three, then compare again.
Can GoAccess and AWStats read the same log file?
Yes. Neither modifies the file. Give AWStats the rotated set through logresolvemerge.pl and let GoAccess handle the live tail.
Does log analytics work for a single-page application?
Poorly. Client-side routing produces no server request, so an SPA session shows up as one pageview plus API calls. Use logs for API and asset visibility, and a script-based tool for the front end.
How long should I keep raw access logs?
Long enough to debug incidents and handle abuse, short enough to limit what a breach would expose — days to a few weeks is a workable range for most sites. Anonymise at write time, keep AWStats aggregates for the long history, and write the retention period down so it’s a decision rather than a default.