Search for “ecommerce metrics to track” and you’ll find articles listing 30, 40, even 70 different KPIs. It’s overwhelming. And frankly, it’s counterproductive.
Here’s the truth most analytics guides won’t tell you: tracking more metrics doesn’t make your store more successful. In fact, it often does the opposite. You end up drowning in dashboards instead of making decisions that actually grow your revenue.
I’ve helped dozens of online store owners simplify their analytics setup. The pattern is always the same—they’re tracking everything but understanding nothing. So let’s fix that.

The Problem with “Track Everything” Advice
Most ecommerce analytics guides are written by tool vendors who benefit from complexity. More metrics mean more features to sell. But for store owners, more metrics usually mean:
- Hours spent staring at dashboards instead of improving products
- Analysis paralysis when every number tells a different story
- Chasing vanity metrics that look good but don’t pay bills
- Missing the signals that actually matter because they’re buried in noise
The solution isn’t better analytics tools. It’s fewer, better metrics.
The Big 5: Ecommerce Metrics That Actually Drive Sales
After years of working with online stores of all sizes, I’ve narrowed it down to five metrics that genuinely matter. Master these, and you’ll outperform competitors who track fifty metrics but act on none.
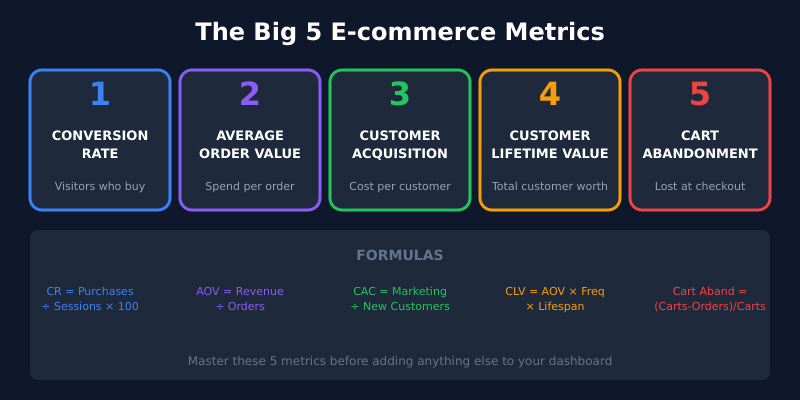
1. Conversion Rate
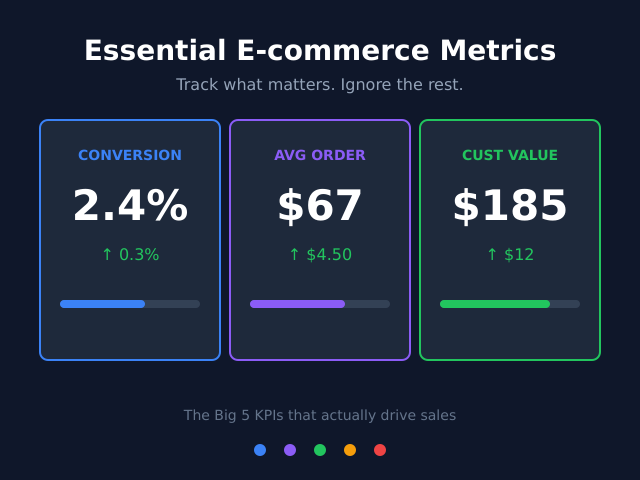
This is the heartbeat of your store. Conversion rate tells you what percentage of visitors actually buy something.
Formula: (Number of Purchases ÷ Number of Sessions) × 100
The average ecommerce conversion rate hovers around 2-3%. However, don’t obsess over industry benchmarks—focus on improving your rate over time. A store converting at 1.5% that improves to 2% has increased revenue by 33% without spending an extra dollar on ads.
What moves it: Page speed, product photography, clear pricing, trust signals, checkout simplicity.
2. Average Order Value (AOV)
AOV reveals how much customers spend per transaction. It’s the easiest lever for growing revenue without acquiring new customers.
Formula: Total Revenue ÷ Number of Orders
If your AOV is $50 and you increase it to $60, that’s 20% more revenue from the same traffic. Cross-sells, bundles, free shipping thresholds—these tactics work because they directly target AOV.
What moves it: Product bundling, upsells at checkout, free shipping minimums, volume discounts.
3. Customer Acquisition Cost (CAC)
CAC tells you how much you’re spending to acquire each new customer. It’s the reality check for your marketing.
Formula: Total Marketing Spend ÷ Number of New Customers
A $30 CAC means nothing in isolation. Compare it to your AOV and CLV. If you’re spending $30 to acquire customers who spend $25 once and never return, you’re losing money. However, if those customers have a lifetime value of $200, you’re building a sustainable business.
What moves it: Channel optimization, audience targeting, organic traffic investment, referral programs.
4. Customer Lifetime Value (CLV)
CLV predicts the total revenue you’ll earn from a customer over your entire relationship. It’s the metric that separates struggling stores from thriving ones.
Formula: Average Order Value × Purchase Frequency × Average Customer Lifespan
Here’s why CLV matters: it determines how much you can afford to spend on acquisition. Stores with high CLV can outbid competitors on ads, offer better deals, and still remain profitable. Additionally, research shows that increasing customer retention by just 5% can boost profits by 25-95%.
What moves it: Email marketing, loyalty programs, product quality, customer service, post-purchase experience.
5. Cart Abandonment Rate
This metric shows what percentage of shoppers add items to their cart but leave without purchasing. The average is around 70%—meaning most stores lose 7 out of 10 potential sales at the finish line.
Formula: (Carts Created − Purchases Completed) ÷ Carts Created × 100
Cart abandonment is where money goes to die. The good news? It’s also where quick wins hide. Unexpected shipping costs, complicated checkouts, and missing payment options are the usual culprits.
What moves it: Transparent pricing, guest checkout, multiple payment methods, abandoned cart emails, trust badges.
Three Secondary Metrics Worth a Glance
Beyond the Big 5, these three metrics provide useful context without demanding daily attention.
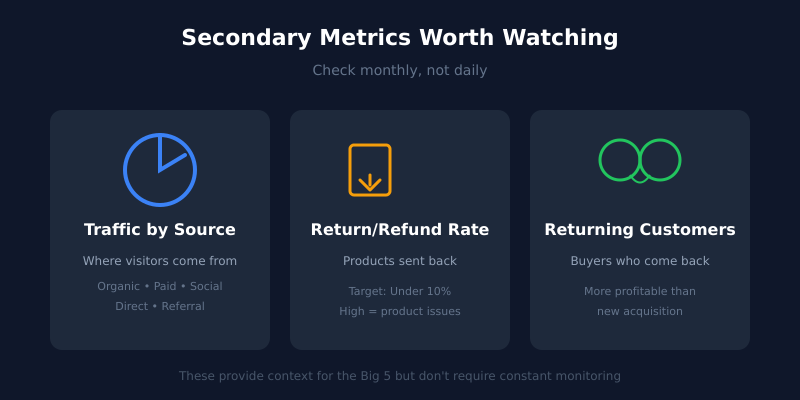
Traffic by Source
Knowing where your visitors come from helps you double down on what works. If organic search drives 40% of your sales but you’re spending 80% of your budget on paid ads, something’s off.
Check this monthly. Look for trends, not daily fluctuations.
Return/Refund Rate
High return rates signal product-market fit problems. Either your products don’t match expectations, your descriptions are misleading, or you’re attracting the wrong customers.
A healthy return rate varies by category, but anything above 10% deserves investigation.
Returning Customer Rate
This tells you what percentage of customers come back for a second purchase. It’s a leading indicator of CLV and a measure of whether your product actually delivers value.
Returning customers are significantly more profitable—they already trust you, they don’t require acquisition spend, and they typically have higher AOV.
What You Can Safely Ignore
Now for the liberating part. Here are metrics you can stop obsessing over:
- Page views — Vanity metric. Someone viewing 20 pages might be confused, not engaged.
- Time on site — A fast purchase is a good purchase. More time often means friction.
- Social media followers — Unless they convert, followers are just numbers.
- Email list size — Engagement rate matters more than raw subscriber count.
- Bounce rate (obsessively) — High bounce on a product page is bad. High bounce on a blog post with an affiliate link? Probably fine.
These metrics have their place in specific contexts, but they shouldn’t occupy prime real estate in your dashboard.
Your Minimalist Ecommerce Dashboard
Here’s what your analytics setup should look like:
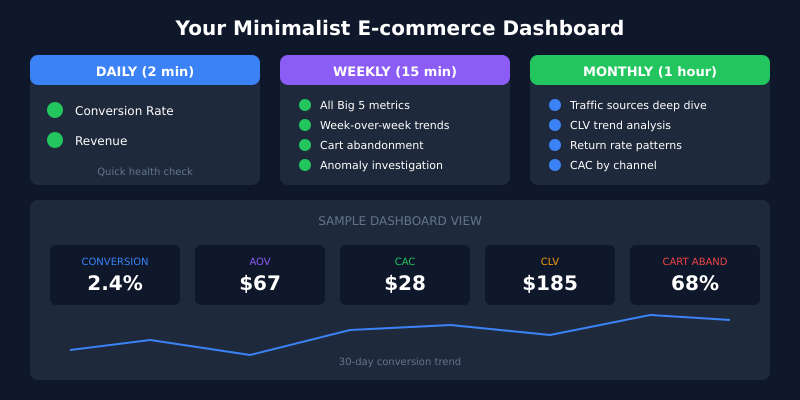
Daily glance (2 minutes):
- Conversion rate — Any sudden drops?
- Revenue — On track for the week/month?
Weekly review (15 minutes):
- All Big 5 metrics with week-over-week comparison
- Cart abandonment trends
- Any anomalies to investigate
Monthly deep dive (1 hour):
- Traffic sources analysis
- CLV trends
- Return rate patterns
- CAC by channel
That’s it. You don’t need hourly dashboard checks. You don’t need real-time alerts for every metric. You need focused attention on what matters.
Choosing the Right Analytics Tool
For ecommerce tracking, you have options beyond the complexity of GA4. Tools like Plausible Analytics offer simplified dashboards that won’t overwhelm you with data you’ll never use. If you’re exploring alternatives, check out our comparison of the best GA4 alternatives.
Most ecommerce platforms (Shopify, WooCommerce, BigCommerce) also provide built-in analytics covering the Big 5 metrics. Often, that’s enough.
The best analytics tool is the one you’ll actually use consistently—not the one with the most features.
Taking Action on Your Metrics
Metrics without action are just entertainment. Here’s a simple framework for turning numbers into improvements:
- Identify the weakest link — Which of your Big 5 metrics underperforms most compared to your goals?
- Hypothesize one fix — What single change might improve it?
- Implement and measure — Make the change, give it 2-4 weeks, check the results.
- Repeat — Move to the next weakest link.
This beats randomly optimizing everything at once. Sequential focus compounds into significant improvement over time.
The Bottom Line
Ecommerce analytics doesn’t have to be complicated. The Big 5 metrics—conversion rate, AOV, CAC, CLV, and cart abandonment—tell you almost everything you need to know about your store’s health.
Track these five metrics consistently. Review them on a sensible schedule. Take action on the insights. That’s the minimalist path to data-driven growth.
Stop tracking 50 metrics and understanding none. Start tracking 5 metrics and mastering them all. Your revenue—and your sanity—will thank you.
Frequently Asked Questions
What’s the most important e-commerce metric to track?
Conversion rate. It connects every other metric to revenue and exposes exactly where the funnel leaks. A store that improves conversion from 1.5 to 2 percent gets a 33 percent revenue lift without spending an extra dollar on traffic.
How do I calculate Customer Lifetime Value for a new store?
Until you have repeat-purchase data, estimate LTV as average order value multiplied by expected order count over a 12-month window. After six months of operation, replace the estimate with actual cohort data — it usually looks quite different from the projection.
Is a 70 percent cart abandonment rate normal?
Yes, the industry average sits around 70 percent. Anything above 80 percent suggests friction in checkout — unexpected shipping costs, forced account creation, missing payment methods or trust issues. Below 60 percent is excellent and usually reflects strong AOV optimization too.
Should I track e-commerce metrics in GA4 or somewhere else?
Most e-commerce platforms (Shopify, WooCommerce, BigCommerce) include built-in dashboards covering the Big 5 metrics. That’s often enough. Add a privacy-friendly tool like Plausible for general traffic analysis and only reach for GA4 if you’re running paid campaigns that require its attribution data.
How often should I review my e-commerce analytics?
Two minutes daily for conversion rate and revenue anomalies, 15 minutes weekly for the full Big 5, and an hour monthly for traffic source analysis and CAC by channel. More frequent than that creates noise, less frequent and you miss real trends.
What’s a good Customer Acquisition Cost for an online store?
CAC has no universal benchmark — it only matters relative to LTV. A healthy store keeps the LTV-to-CAC ratio at 3:1 or better. Spending $50 to acquire a customer worth $200 over their lifetime is sustainable; spending $50 for a $40 one-time customer is not.
Do I need to track e-commerce events server-side?
Server-side tracking improves data accuracy by bypassing ad blockers and browser tracking restrictions, but it adds engineering complexity. For most stores under $1M in revenue, well-configured client-side tracking through your platform’s native integrations is enough. Revisit server-side once attribution data starts driving meaningful budget decisions.