I ran Lighthouse five times each against eight identical pages — one with no tracking at all, seven with a different analytics script in the head. Every page scored 100. Plausible, Fathom, Umami, GoatCounter, Simple Analytics, Matomo, GA4: all 100, on all 40 runs, with Total Blocking Time at 0 ms throughout. So if you were hoping a Lighthouse run would settle the privacy analytics performance question for you, it won’t.
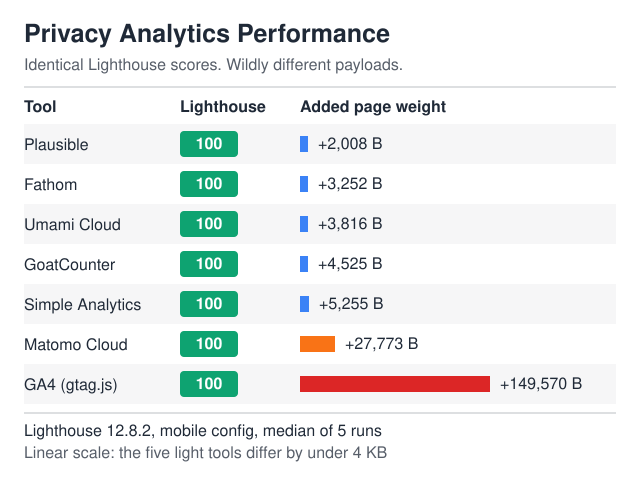
The score simply cannot see the difference. A deferred script that arrives after first paint barely touches the metrics the score is built from, so the number stays pinned at 100 whether you ship 2 KB or 146 KB.
Two things did move. Page transfer weight: the bare page pulled 3,698 bytes, Plausible took it to 5,706, and GA4’s gtag.js took it to 153,268 — about 146 KB added, roughly forty times the weight of everything else on the page combined. And main-thread CPU: 56 ms on the bare page, 146 ms with GA4, while the privacy tools added between 3 and 25 ms.
Here’s the full test, the raw script weights, and what the numbers actually mean when you’re picking a tool.
How the test was built
Eight static HTML files, byte-identical apart from one line in the <head>. Each page carries the same ~1.7 KB of markup, the same inline CSS, no images, no fonts, no other third-party requests. Placeholder site IDs throughout, since the point was to measure what the browser downloads and executes, not to send real hits anywhere.
Served from 127.0.0.1 over a local HTTP server, driven by Lighthouse in headless Chrome. Default mobile configuration: simulated throttling at 150 ms RTT and 1,638 Kbps, with a 4× CPU slowdown multiplier. Five runs per variant, medians reported.
A synthetic page rather than a real one, because on production the analytics script is a rounding error next to hero images, web fonts and your own JavaScript. That’s part of the finding in itself — but it makes tool-to-tool differences impossible to see.
What each page actually cost
| Page | Lighthouse score (5 runs) | Total transfer | Δ vs bare page | Third-party main-thread | TBT |
|---|---|---|---|---|---|
| No analytics | 100 | 3,698 B | — | — | 0 ms |
| Plausible | 100 | 5,706 B | +2,008 B | 25 ms | 0 ms |
| Fathom | 100 | 6,950 B | +3,252 B | 7 ms | 0 ms |
| Umami Cloud | 100 | 7,514 B | +3,816 B | 7 ms | 0 ms |
| GoatCounter | 100 | 8,223 B | +4,525 B | 3 ms | 0 ms |
| Simple Analytics | 100 | 8,953 B | +5,255 B | 14 ms | 0 ms |
| Matomo Cloud | 100 | 31,471 B | +27,773 B | 18 ms | 0 ms |
GA4 (gtag.js) |
100 | 153,268 B | +149,570 B | 80 ms | 0 ms |
Two entries deserve a flag. Plausible ships the smallest script of the seven, yet its median main-thread time landed above Fathom’s and Umami’s — 25 ms, across runs of 5, 21, 25, 27 and 26 ms. Simple Analytics was similarly jumpy at 13–32 ms. Wide spreads on small absolute numbers are exactly where single-run benchmarks mislead, so read those two as “under 30 ms” rather than as precise figures.
GA4, by contrast, was the most consistent result in the whole test: 80, 80, 88, 83, 80 ms. It was also the only script Lighthouse’s own JavaScript execution time audit bothered to report at all — 79 ms, where every privacy tool registered 0 ms and fell below the reporting threshold.
Why every page scored 100
Pull the scoring weights apart and it’s obvious. The performance score is five metrics: Total Blocking Time at 30%, Largest Contentful Paint at 25%, Cumulative Layout Shift at 25%, First Contentful Paint at 10%, Speed Index at 10%. Those are the weights Google publishes in the Lighthouse scoring reference.
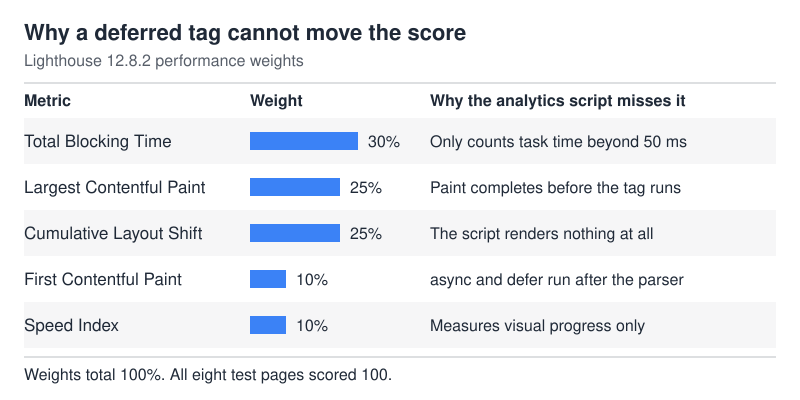
A correctly-tagged analytics script interacts with none of them in any meaningful way:
- CLS (25%) — analytics renders nothing, so it shifts nothing. Structurally zero.
- LCP and FCP (35% combined) —
asyncanddeferboth push execution past the parser, so the script lands after the paint that gets measured. - TBT (30%) — Total Blocking Time only counts the portion of a task that runs past 50 ms. GA4’s 80 ms of main-thread work arrives as a spread of small tasks, not one long block, so it contributes nothing.
- Speed Index (10%) — visual progress only. Invisible scripts are invisible.
Therefore a 100/100 Lighthouse score is compatible with shipping a 146 KB tag to every visitor. That’s not a bug in Lighthouse; it’s Lighthouse measuring what it says it measures. It just makes the score useless as a tool-selection input.
The raw scripts, fetched directly
Independent of any page, here’s what each vendor’s tracker weighs on the wire. Fetched with curl on the same day, uncompressed and gzipped:
| Script | Uncompressed | Gzipped |
|---|---|---|
counter.dev script.js |
1,112 B | 435 B |
Plausible script.js |
2,855 B | 1,284 B |
Umami Cloud script.js |
4,672 B | 2,276 B |
Fathom script.js |
6,905 B | 2,071 B |
Simple Analytics latest.js |
7,515 B | 3,854 B |
GoatCounter count.js |
9,213 B | 3,358 B |
Pirsch pa.js |
11,842 B | 3,567 B |
Rybbit script.js |
32,875 B | 10,842 B |
Matomo matomo.js |
83,875 B | 28,127 B |
GA4 gtag.js |
417,160 B | 148,295 B |
Plausible’s script measured 1,284 bytes gzipped — light, but not under a kilobyte. Feature flags matter here: the tagged-events plus revenue plus pageview-props build came in at 4,581 B uncompressed against 2,855 B for the base script. Whatever number you saw quoted for a tracker, check which build it refers to before you budget around it.
Matomo is the interesting middle case. At 28 KB gzipped it sits an order of magnitude above the minimalist tools and an order of magnitude below GA4 — which is what a full analytics platform costs versus a counter. The Matomo review covers what that weight buys, and the self-hosted versus SaaS comparison covers where you’d run it.
What the heavy tag buys, and where it stops
It’s worth being fair to gtag.js. The 146 KB isn’t padding. It’s a tag manager interface, consent signalling, ecommerce schema, cross-domain linking and a configuration layer that talks to Google Ads, all shipped to every visitor whether the page uses those features or not. The minimalist trackers weigh 2 KB because they do roughly one thing — count pageviews and referrers — and push everything else to the server.
But weight doesn’t buy unlimited flexibility. A standard GA4 property allows 50 event-scoped custom dimensions and 50 custom metrics, and those ceilings are what you hit first when you try to model anything the default schema didn’t anticipate. Google publishes the full set in its GA4 configuration limits reference. Fifty sounds generous until you start splitting a funnel by product line, plan tier and campaign shape at once. It isn’t a budget you iterate on casually — you plan the taxonomy, then you spend the slots.
So the trade isn’t “heavy but unlimited” against “light but crippled”. It’s a fixed schema you configure through a UI, against a lighter tool where custom data usually means an explicit event call you write yourself. Both have ceilings. They just sit in different places, and only one of them costs you 146 KB on every pageview.
The consent layer is part of the performance budget
On a lot of European sites, the consent management platform is heavier than the analytics tag it gates. Measuring the tracker alone and ignoring the banner in front of it understates what the visitor actually downloads — and it’s an easy thing to leave out of a before-and-after you run on yourself.
The reason that banner exists at all, for a Google stack, is Consent Mode v2. Since March 2024, sites using Google’s advertising and measurement products with users in the EEA have had to pass two additional signals — ad_user_data and ad_personalization — alongside the original storage flags. Google applies the same requirement to the UK and Switzerland through its own EU User Consent Policy, which is a contractual term of Google’s rather than an EU statutory obligation; the two grounds are worth keeping separate when you’re scoping the work, because they can change independently. Sites that don’t send the signals lose personalisation and remarketing for those users, plus the measurement features that depend on them. I’ve written the mechanics up separately in Consent Mode v2 explained.
What that means for page weight is simple: a GA4 install in Europe is rarely just gtag.js. It’s gtag.js plus a CMP script, plus the banner’s own CSS, plus a second configuration pass once the user clicks. That whole stack is what you’re really comparing against a 2 KB cookieless counter, not the 146 KB in isolation.
The mistake in the other direction is assuming a cookieless tool is automatically consent-free. The EDPB settled the technical question in Guidelines 2/2023 on the technical scope of Article 5(3) of the ePrivacy Directive, version 2.0, adopted on 7 October 2024. The consent rule attaches to storing information on, or gaining access to information already stored in, a user’s terminal equipment — not to cookies specifically. Local storage, certain URL and pixel-based techniques, and some fingerprinting sit inside the same perimeter. So whether a given tracker needs a banner depends on what it touches on the device, which is a question about the implementation in front of you, not about the word “cookieless” on a pricing page.
The script shows up in field data, not lab data
A lab test like this one is the wrong instrument for the question most people are actually asking: will this slow the site down for real users. That needs field data — real sessions, real devices, real networks — which is what the Chrome UX Report collects and what Search Console surfaces.
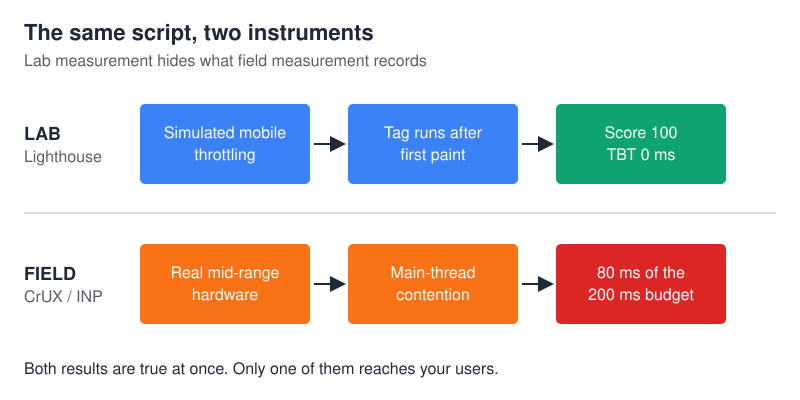
The metric to watch there is Interaction to Next Paint, not LCP. INP measures how long a page takes to respond visually after a user interacts, and Google’s “good” threshold is 200 ms or less. Main-thread contention is exactly what pushes it up. The 80 ms of tag execution I measured is 40% of that budget on its own, before any of your own code runs — and this test’s 4× throttling model is gentler than real mid-range hardware, so treat 80 ms as a floor rather than a ceiling.
That’s the practical case against heavyweight tags, and it never shows up in a Lighthouse score. It shows up in CrUX, on a rolling window, weeks later.
Automating the check is where people get stuck, because the two data sources don’t live in the same place. The Search Console API covers search performance, not the vitals report, and it makes you page through results: a single Search Analytics call returns at most 25,000 rows, and defaults to 1,000, per Google’s searchanalytics.query reference. Field vitals come from CrUX instead, through its own API or the public BigQuery dataset. If you want a before-and-after dashboard around a tag swap, you’re joining two sources, not querying one — and how far back the baseline can reach is limited by the history window Search Console keeps, which is reason enough to pull and store your own copy before you need it.
Where privacy analytics performance actually matters
The performance argument for privacy-first analytics is real, but narrower than the marketing suggests. Ranking Plausible above GoatCounter because one is 1.3 KB and the other 3.3 KB is noise — a 2 KB gap on a page whose hero image is 200 KB. Between any two of the minimalist trackers, performance is a tie; decide on features, pricing and data residency instead.
The gap that is real sits between the minimalist tier and gtag.js. 146 KB and 80 ms of main-thread work on every pageview is a genuine budget line, especially on mobile, especially next to a consent banner loading its own script. If your site is already slow, that gap matters. If it’s fast, it’s insurance.
So, five rules I’d apply:
- Stop using Lighthouse to compare analytics tools. It cannot see the difference. Compare transfer size and main-thread time instead — both are in the DevTools network and performance panels for free.
- Measure your own page, not a benchmark page. A 3 KB tag on a 4 MB page is not the problem you’re solving.
- Check INP in field data before and after a swap. If it doesn’t move, the tag was never your bottleneck.
- Count the consent banner in the analytics budget. A cookieless tool that removes a banner script often saves more weight than the tracker itself does.
- Watch feature flags. Every optional module you enable inflates the script; the sub-2 KB numbers are base builds.
What this test doesn’t prove
Simulated throttling is a model, not a device. Real mid-range Android hardware behaves worse than a 4× multiplier on a datacentre CPU, so the GA4 figures here are probably conservative rather than inflated.
Placeholder site IDs also meant the vendors’ back-ends handled beacons differently — Umami and GA4 fired one, Fathom didn’t. This is a fair comparison of script download and execution, not of beacon behaviour. Largest Contentful Paint was unstable across runs in a way that didn’t track script weight at all, so I’ve left it out rather than dress up noise as a finding.
It also says nothing about what happens after the script loads. Server-side processing time, dashboard query speed, the cost of a self-hosted instance under real traffic — none of that is visible from the browser, and for some tools it’s the more interesting number. This test stops at the point the beacon leaves the page.
And it’s one page, one host, one day. CDN routing, vendor updates and your own edge config will all shift the absolute numbers. What’s durable is the ordering — and the ordering has exactly one real step in it, between the counters and gtag.js. For what life at the light end is actually like, the GoatCounter review and the Plausible review both cover the trade-offs that come with a small footprint.
Frequently asked questions
Does adding Google Analytics lower my Lighthouse score?
Not on its own, based on this test. A page scoring 100 with no analytics still scored 100 with gtag.js loaded async, across five runs. GA4 can hurt a score indirectly — if it’s loaded synchronously in the head, or bundled through a tag manager that pulls in additional tags — but the plain GA4 snippet placed correctly doesn’t cost points.
Which privacy analytics tool is fastest?
By main-thread time in this test, GoatCounter at 3 ms. By raw script size, counter.dev at 435 B gzipped. However, the five lightest tools — Plausible, Fathom, Umami, GoatCounter and Simple Analytics — all landed under 5.5 KB of added page weight and no more than 25 ms of main-thread time. On a real page, none of that is something a visitor would feel, so pick on features instead.
Is privacy analytics performance a good enough reason to switch tools?
On its own, usually not. The measured gap between gtag.js and a cookieless counter is real — 146 KB and 80 ms per pageview — but it only changes the experience on sites already close to the edge. Where it justifies itself is as a compound: lighter tag, no consent banner, less main-thread contention, a simpler data model to maintain. Any one of those is a rounding error. Together they add up to a page that behaves differently.
Why is Total Blocking Time 0 ms even for the 146 KB script?
TBT only counts time in tasks longer than 50 ms, and only the portion past that 50 ms mark. GA4’s work arrives as many short tasks rather than one long one, so none of it crosses the threshold. This is a known limitation of using TBT as a proxy for responsiveness, which is why the field question is answered by INP rather than by a lab proxy.
Should I self-host the analytics script to avoid the third-party request?
It removes a DNS lookup and TLS handshake to another origin, which saves the setup cost of a cold connection. It also breaks vendor script updates unless you automate the sync. For a 2 KB script the saving is marginal; for Matomo at 28 KB served from your own CDN it’s more defensible.
How do I reproduce this on my own site?
Open DevTools, filter the network panel to Scripts, and record a hard reload — that gives you transfer size per script. Then run a performance profile and check the bottom-up view for time attributed to the tracker’s origin. Both take about two minutes and are more useful than any score out of 100.